Tutorial: Exploring M2M-PostAViz with Example Data
This tutorial demonstrates how to use M2M-PostAViz with the built-in test dataset. You will learn how to launch the application, navigate its main features, and interpret the results.
Prerequisites
M2M-PostAViz is installed (see Installation)
You have access to a terminal or command prompt
Step 1: Launch the Application with Test Data
Run the following command in your terminal:
m2m_postaviz --test
This will extract and process example data from the
postaviz_test_datadirectory.The process may take a few seconds.
The Shiny web application will open automatically in your browser.
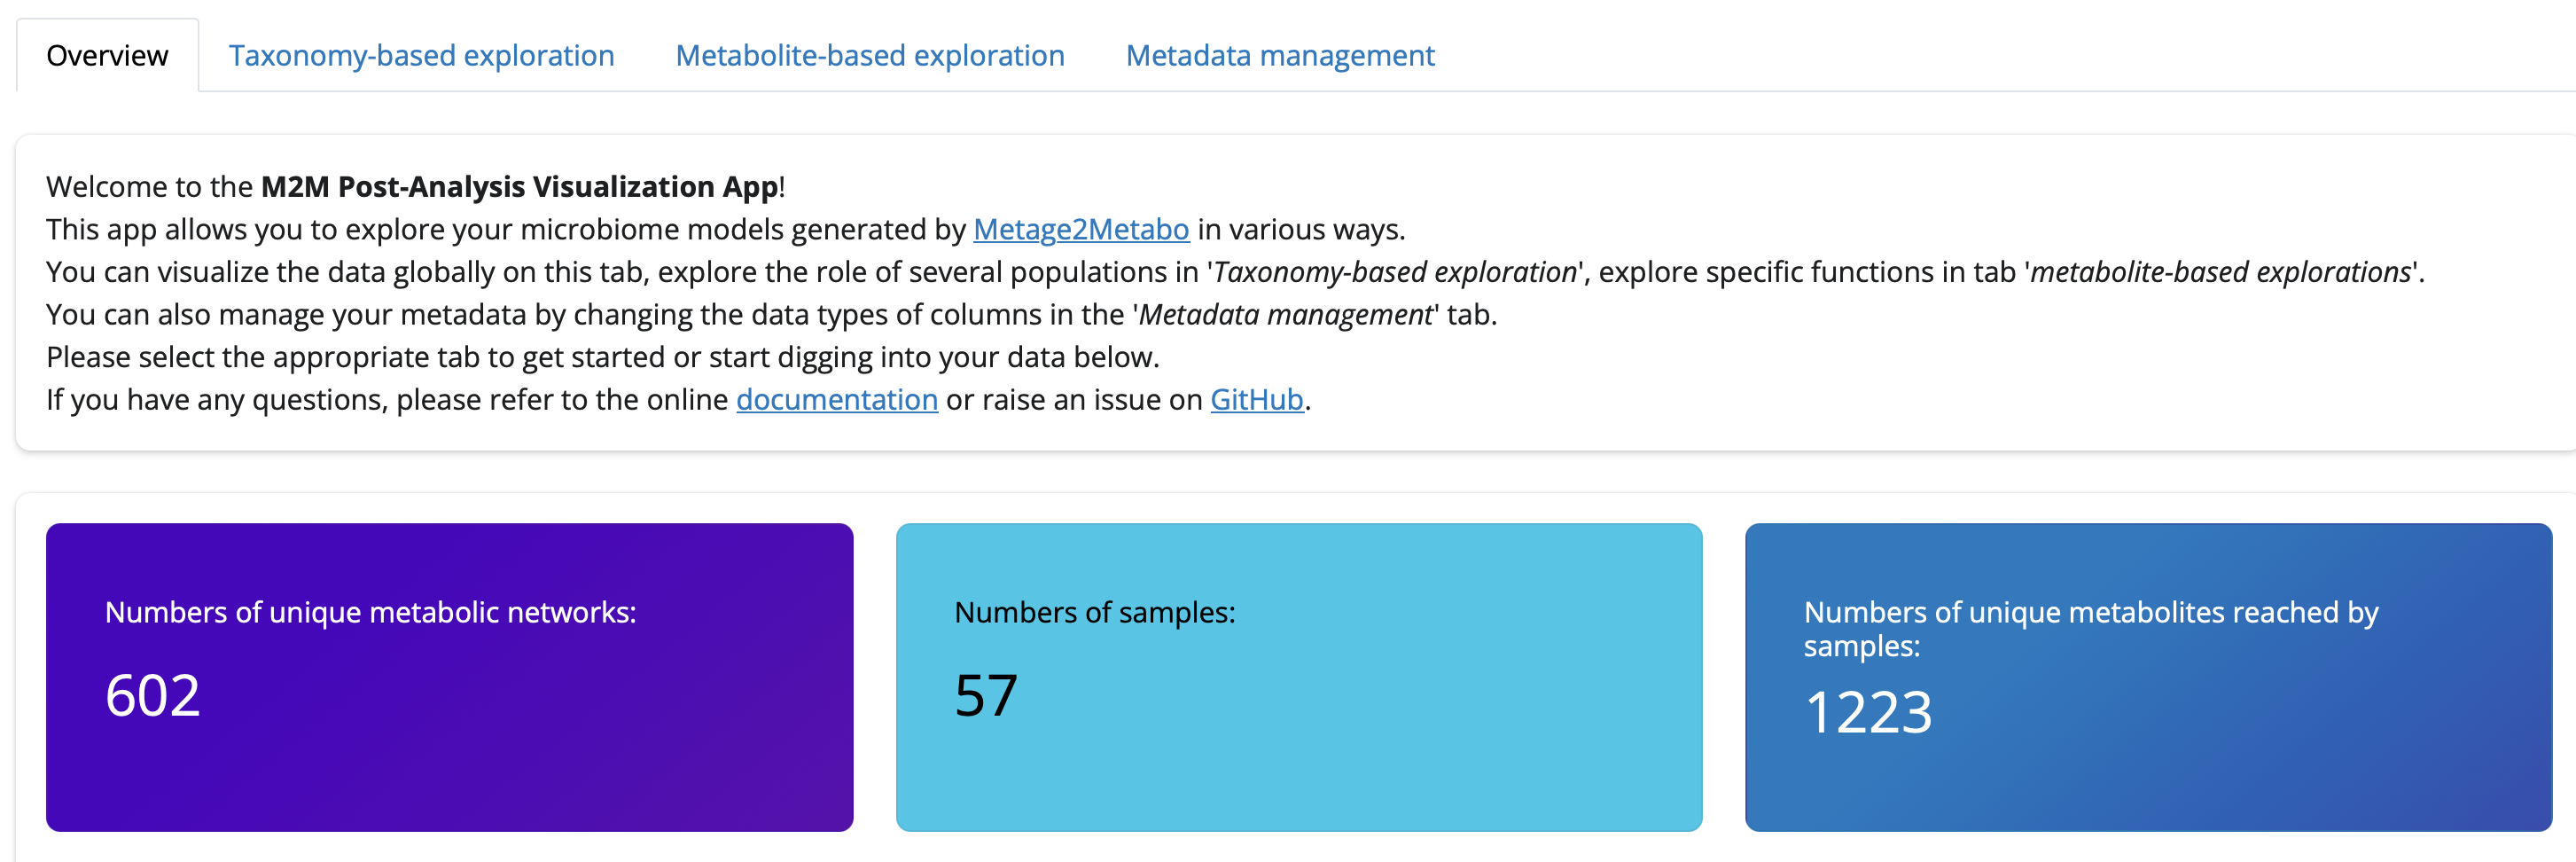
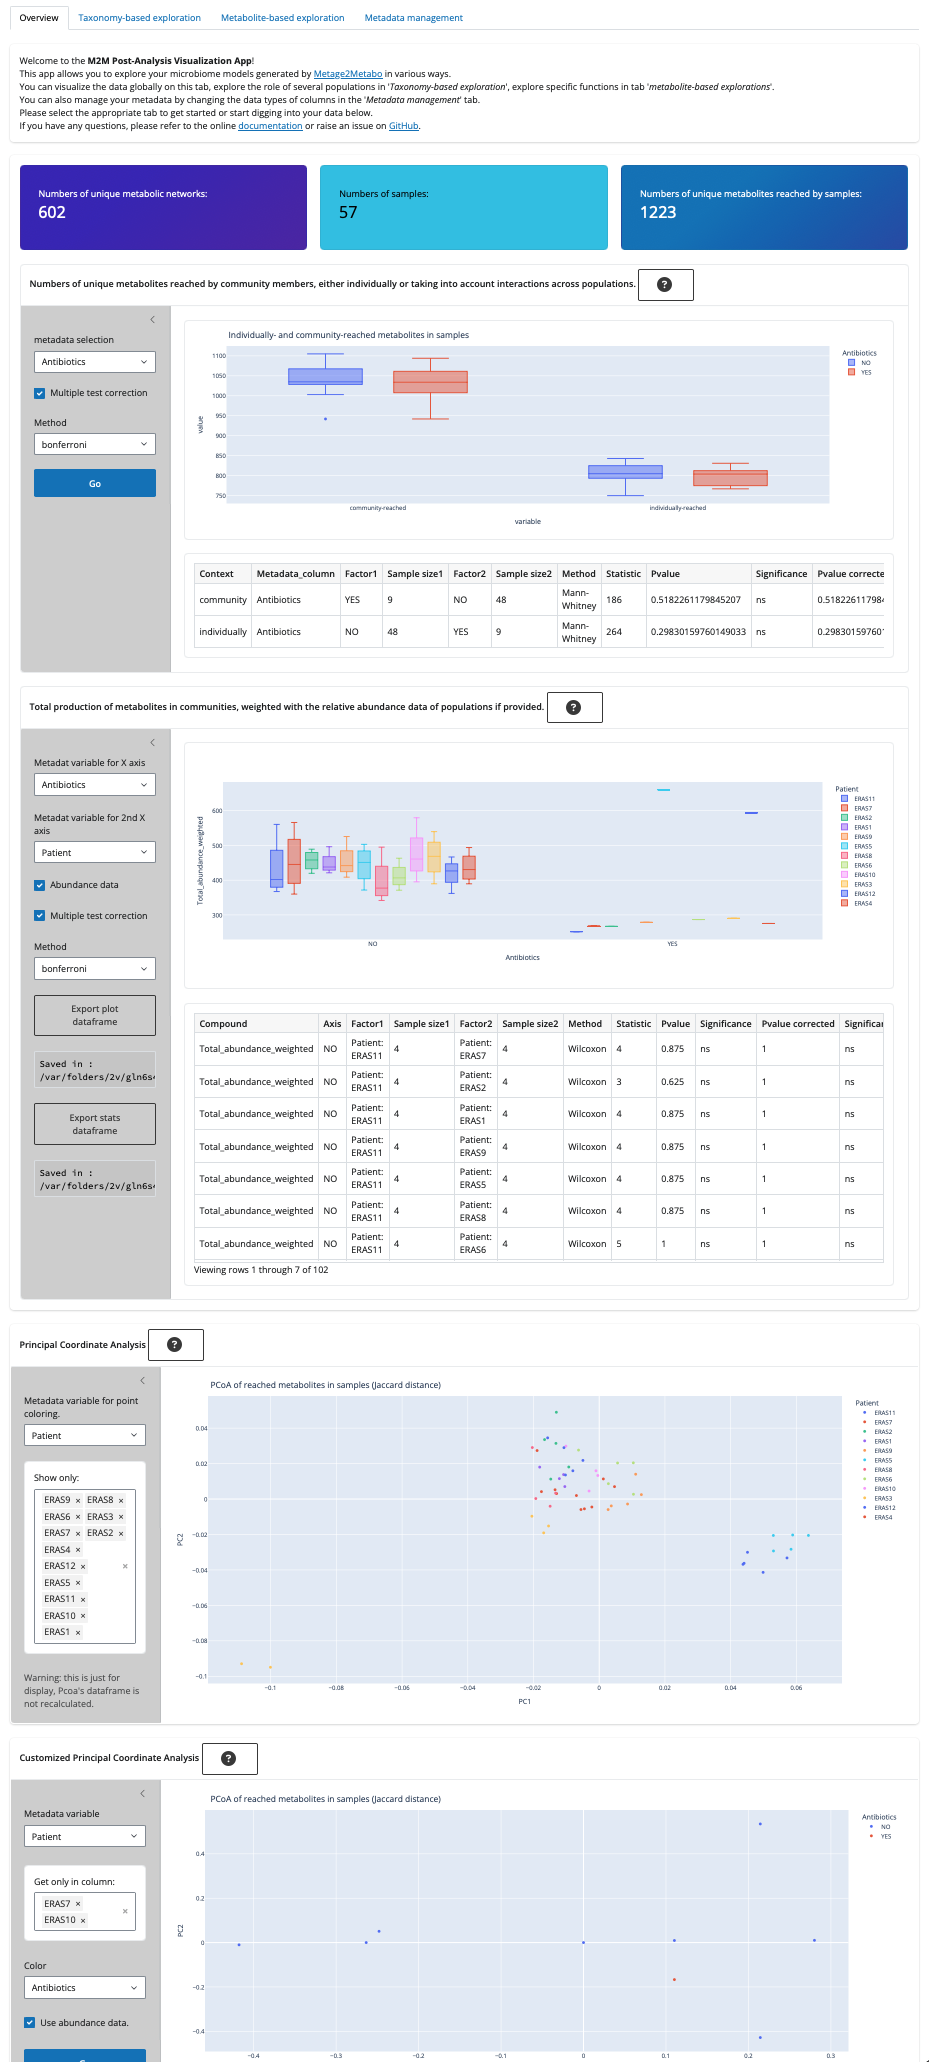
Step 2: Overview Tab
What you see: Summary statistics: number of metabolic networks, samples, and unique metabolites.
Plots: - Number of unique metabolites per sample - Total number of compounds reached - Principal Coordinate Analysis (PCoA) plots
Try: - Grouping samples by metadata variables - Exporting data frames and plots
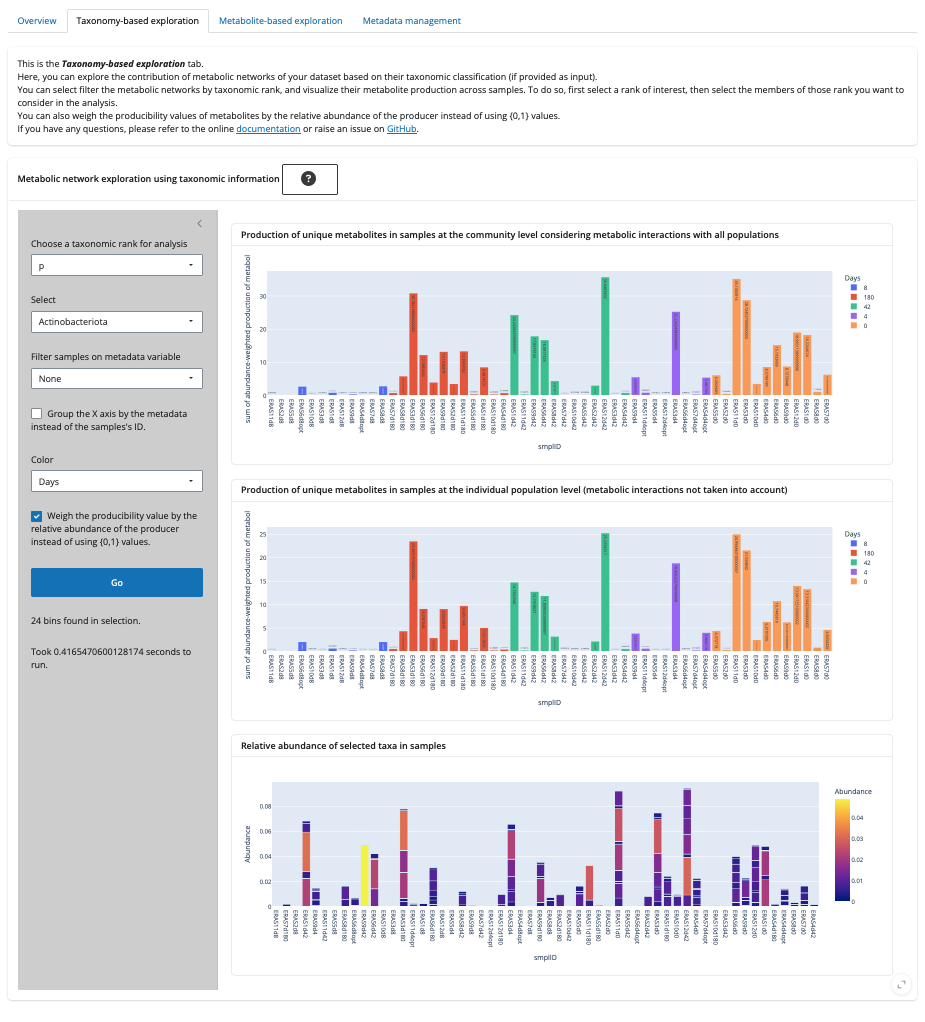
Step 3: Taxonomy-based Exploration Tab
Purpose: Explore metabolic potential by taxonomic groups or individual genomes.
Actions: - Select taxonomic rank (e.g., phylum, genus) - Filter samples by metadata - Enable abundance weighting
Plots: - Number of metabolites produced by selected taxa (individual and community metabolic potentials) - Relative abundance of selected taxa in samples
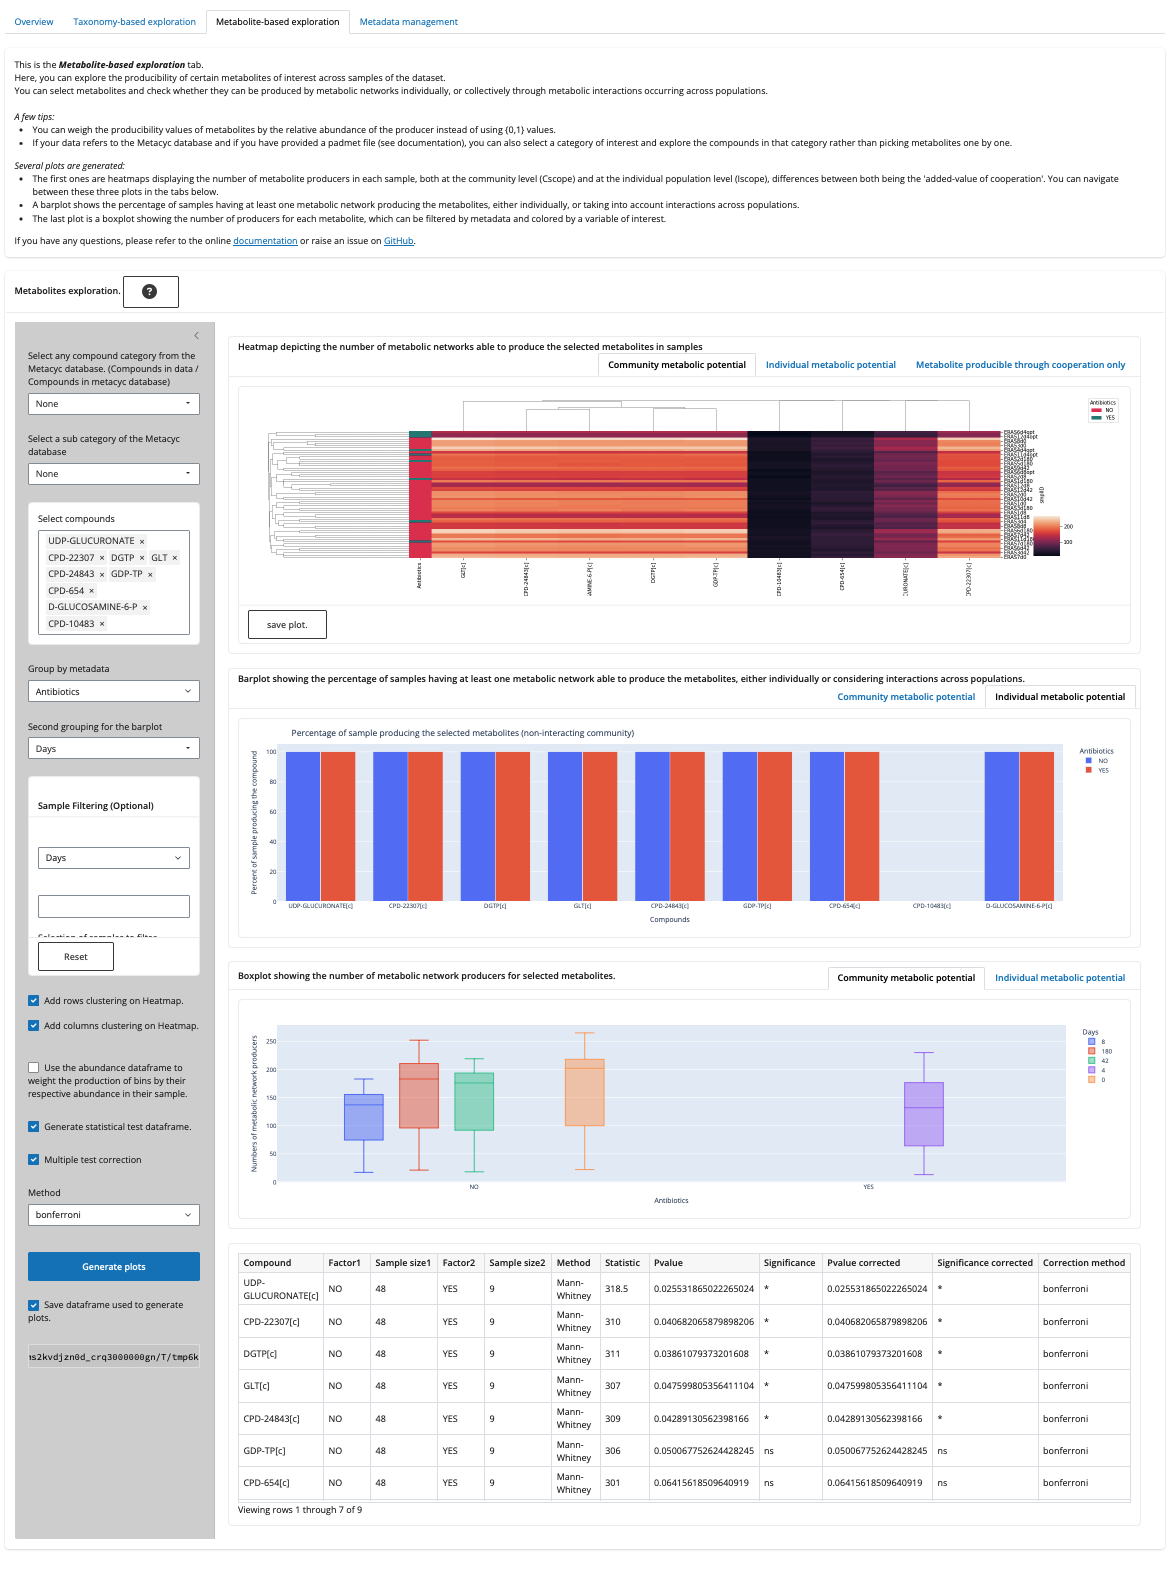
Step 4: Metabolite-based Exploration Tab
Purpose: Explore the production of specific metabolites or compound families.
Actions: - Select compounds (Metacyc data is not available with the test data) - Filter and group samples by metadata - Enable clustering for heatmaps depicting the number of producers for each metabolites by groups.
Plots: - Heatmaps of compound production - Percentage of samples producing selected compounds - Boxplots grouped by metadata
Step 5: Metadata Management Tab
Purpose: Review and edit metadata types for your variables.
Actions: - Change variable types (categorical, numeric, etc.) - See how changes affect plots and analyses
Step 6: Exporting Results
Export: - Try downloading data frames, plots, and statistical results from each tab for further analysis.
Tips and Notes
The test dataset is small and designed for demonstration purposes.
For your own data, see Input Data and Usage.
Some features (e.g., Metacyc ontology) are not available in this mode.
Next Steps
Try running M2M-PostAViz with your own data generated with Metage2Metabo.
Explore advanced options and custom analyses.